Industrial Multi-Sensor Monitoring & Analytics

Intell-i-Watch

More sensors. More insight. Less complexity.

Technical & Engineering Resources

Data, trending & analysis

Datalogging, trending, alarms and data management for reporting

What the Watch monitors

Harvesting sensor feedback data can be used to interpret, trend and analyze that information from one or multiple sensors to optimize and improve processes, create predictive results to improve proactive actions and avoid cyclical system upset.

Data logs can be your source of documented process results to remove uncertainty by having credible measured process information.

  • Datalogging
  • Trend graphs
  • Rolling averages
  • Min/max
  • Monthly statistics
  • Alarm logs
  • Email and text alarms
  • CSV export
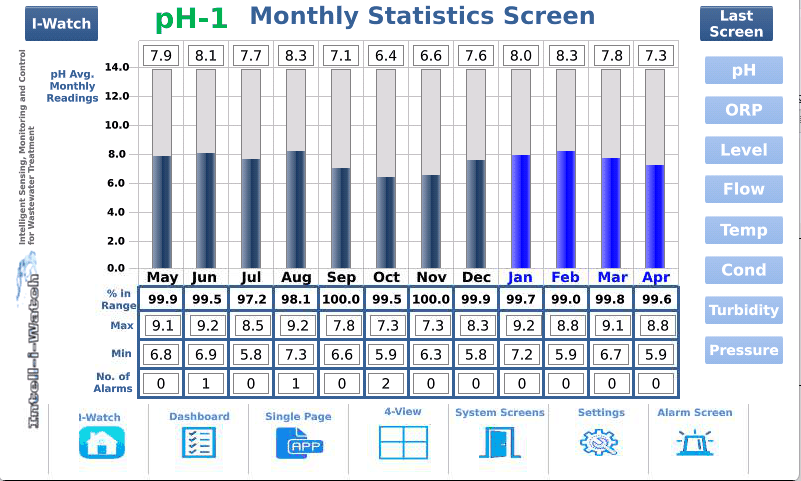
Intell-i-Watch monthly statistics screen

How the Watch works for data, trending & analysis

Your sensors in. Readings, alarms, records and analysis out.

1Your sensors

Any sensor the Watch reads

Water qualityProcessEquipmentEnergy

Most standard analog and on/off sensors.

2The Watch

Intell-i-Watch

Monitor. Log. Analyze.

pH 17.8Normal
Level 151.7 inNormal
Temp 170.2 °FNormal

Logs and analyzes on its own – no network needed

3What you get

On the Watch

  • Date- and time-stamped logs
  • Alarm log
  • Trend graphs and statistics

To your PC

  • SD card to USB by on-screen steps
  • CSV file into Excel

In a browser

  • Password-protected web server pages
  • Pages set up for specific people

To your phone or inbox

  • Email and text alarm notifications

Some features depend on the model. Network connections are optional and turned on only with your approval.

Analysis on the Watch – no network needed

The Intell-i-Watch logs and analyzes your data inside the monitor itself. No internet, cloud service, plant or IT network, or remote access is needed for that.

  • Analysis keeps working when the network is down, or where there is none.
  • No IT or cloud integration is needed for analysis.
  • Data is analyzed where it is collected.
  • Suited to remote sites and facilities with restricted network access.

Connected features – email and text alerts, web server pages, file transfer and remote viewing – are optional and turned on only with your approval.

What you see on the Watch

  • All models with a built-in screen. Live readings, bar graphs, trend graphs, averages and min/max, right on the Watch.
  • 5" and larger screens (IW-888, IW-101012, IW-102412, IW-182612, IWC). Also logged history – trend graphs with date and time – and alarm logs on screen.
  • 3.5" screens (IW-332, IW-444, IW-646). Logged data moves to a PC on the memory card or by USB for longer-term review.
  • IW-Uniscreen VDM. No built-in screen: you view it on your own PC, tablet or phone connected to the Watch.

Getting your data

Intell-i-Watch models can operate independent of any network connections, and stored data logs can be manually transferred to additional permanent storage devices. Historical data can be accessed on the monitor and viewed as trend graphs with all data logged and date stamped.

All of these communication capabilities are intended to be approved and authorized by the customer's IT/OT supervisory personnel. Optional connectivity features are only enabled with customer approval.

  • Works on its own. No network connection is needed.
  • Date- and time-stamped logs. Data logs include the time and date of the measurements.
  • CSV export for Excel. Data logs can be exported as a CSV file to Microsoft Excel and other programs.
  • SD card to USB. Data logs, files and screen images can be moved from the on-board memory (SD card) to a USB memory device by following on-screen instructions and prompts.
  • Web server pages. Password-protected pages can be set up so specific people see only the sensor data that matters to them.
  • Email and text alarms. Alarm notifications can be sent by email or text message to different groups of responsibility.

Screen tour

What you see on the screen

26 screens, grouped the way you use them. Screens shown are examples with example values; the screens on your Watch depend on the model and the sensors connected.

Set it up your way

Intell-i-Watch Guided setup screen

Set it up your way

Guided setup

Setup starts with a welcome screen that leads you through configuring your Intell-i-Watch one step at a time.

  • Units, sensor names, normal ranges and alarms are set up screen by screen, in order.
  • The Watch is set up for your sensors and your process, not a one-size-fits-all template.
  • Anything you set can be changed later, right at the Watch, as your process changes.
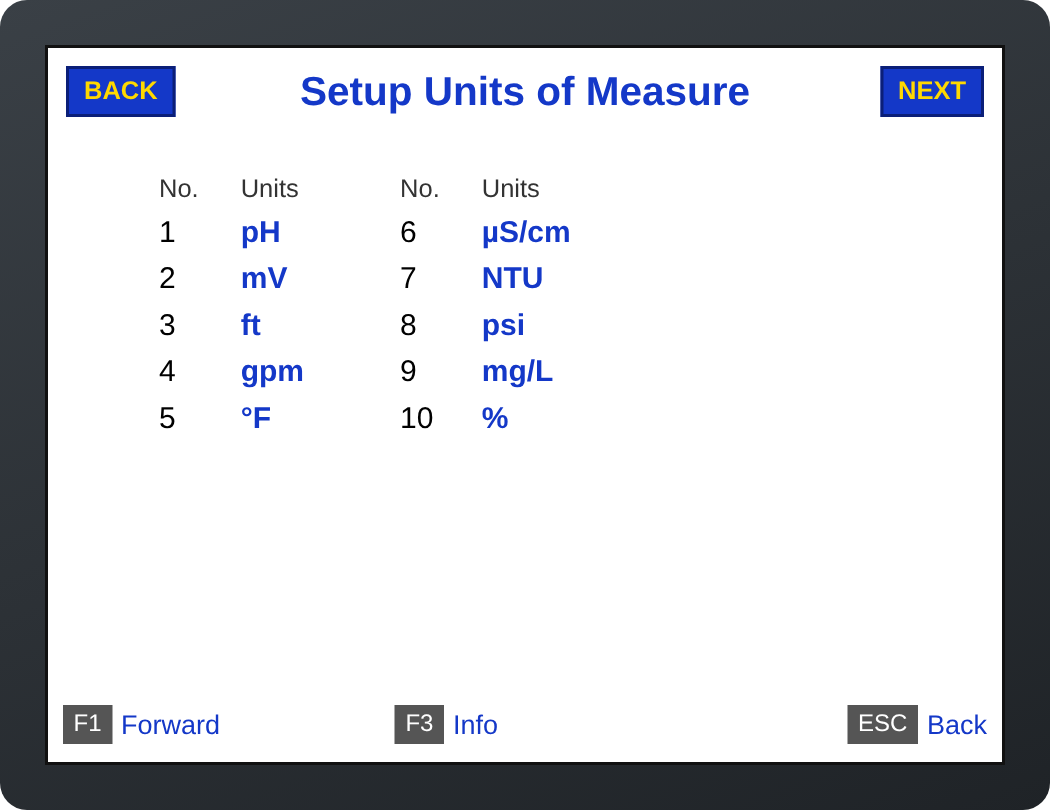
Intell-i-Watch Units of measure screen

Set it up your way

Units of measure

Every reading shows in the units your team already works with.

  • Choose units such as pH, mV, feet, gpm, °F, µS/cm, NTU, psi, mg/L or percent.
  • Each sensor gets its own units, so every screen and every data log reads the way you expect.
  • No conversions in your head and no confusion between shifts.
Intell-i-Watch Normal, alert and alarm ranges screen

Set it up your way

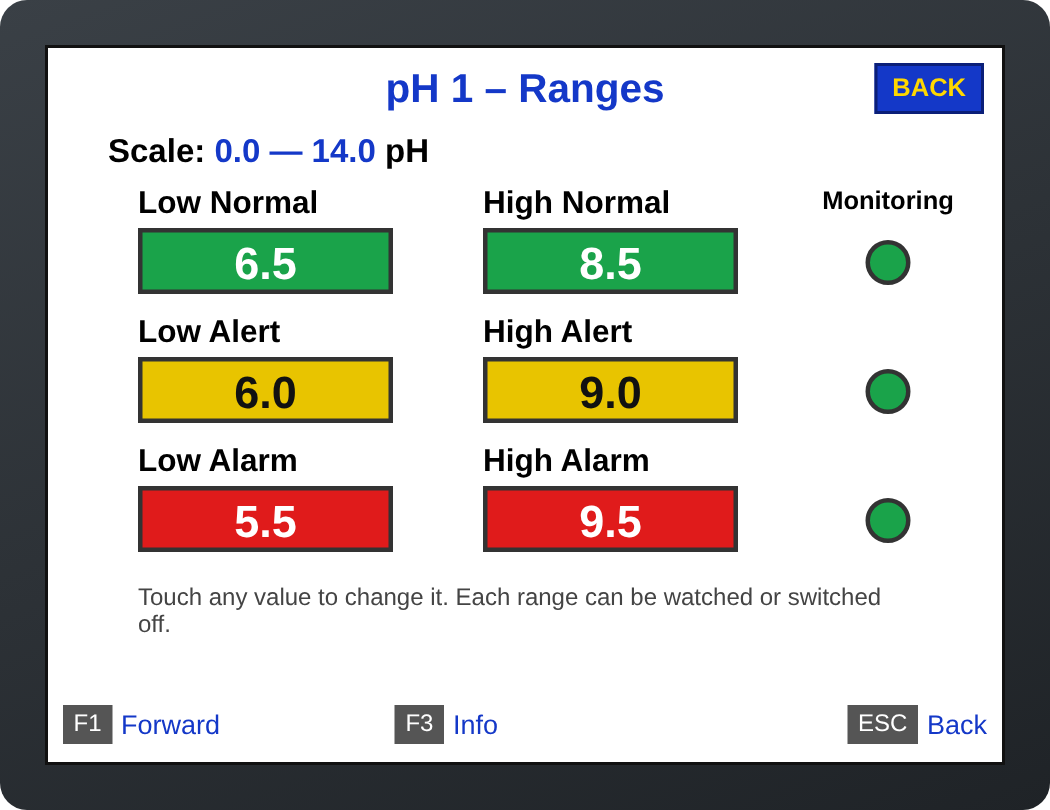
Normal, alert and alarm ranges

You decide what “normal” looks like for each sensor, and the Watch watches for anything outside it.

  • Green normal range: where you want the process to run.
  • Yellow alert range: an early warning that the process is drifting, before it becomes a problem.
  • Red alarm range: the limits that need action now.
  • Set the low and high value of each range on the screen, and change them any time. Each range can be watched or switched off.

See your whole process at a glance

Intell-i-Watch Overview – measurements screen

See your whole process at a glance

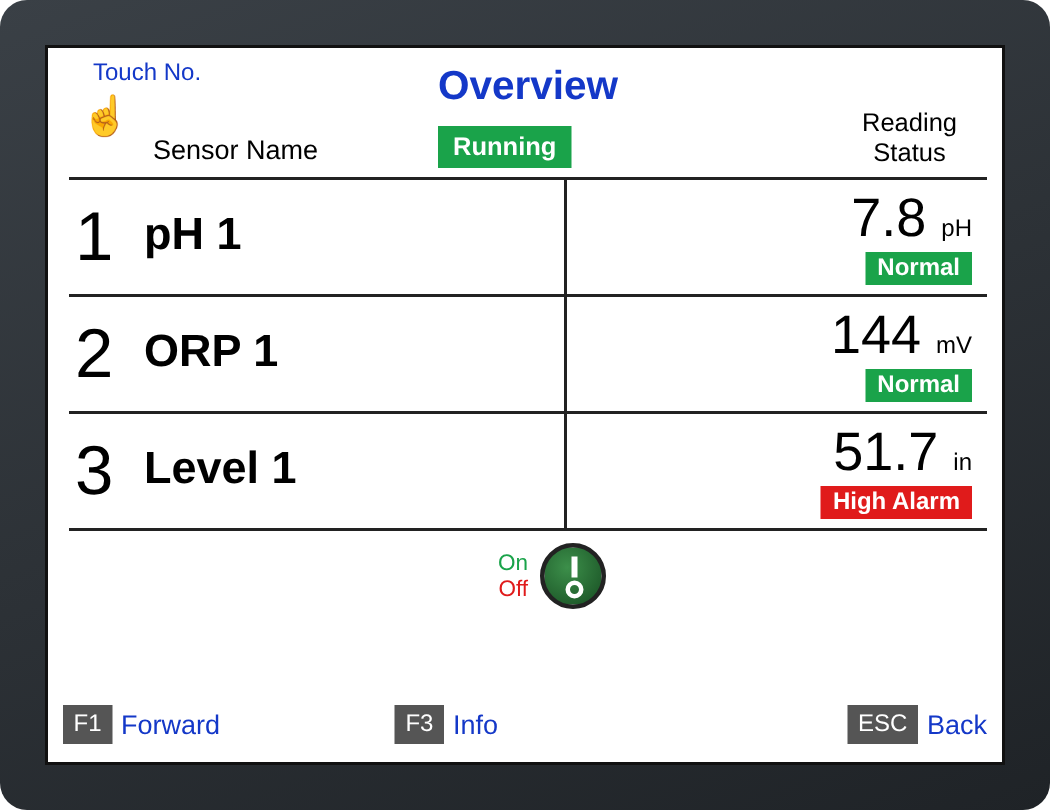
Overview – measurements

One screen shows every sensor: its name, its live reading and its status.

  • Anything outside its normal range stands out in color right away, with Low or High shown.
  • Touch a sensor's number to jump to that sensor's own screen.
  • The Running indicator and the On/Off switch show and control monitoring. Monitoring can run around the clock, be started and stopped with the switch or an outside signal, or follow a daily or weekly schedule.
Intell-i-Watch Overview – on/off sensors screen

See your whole process at a glance

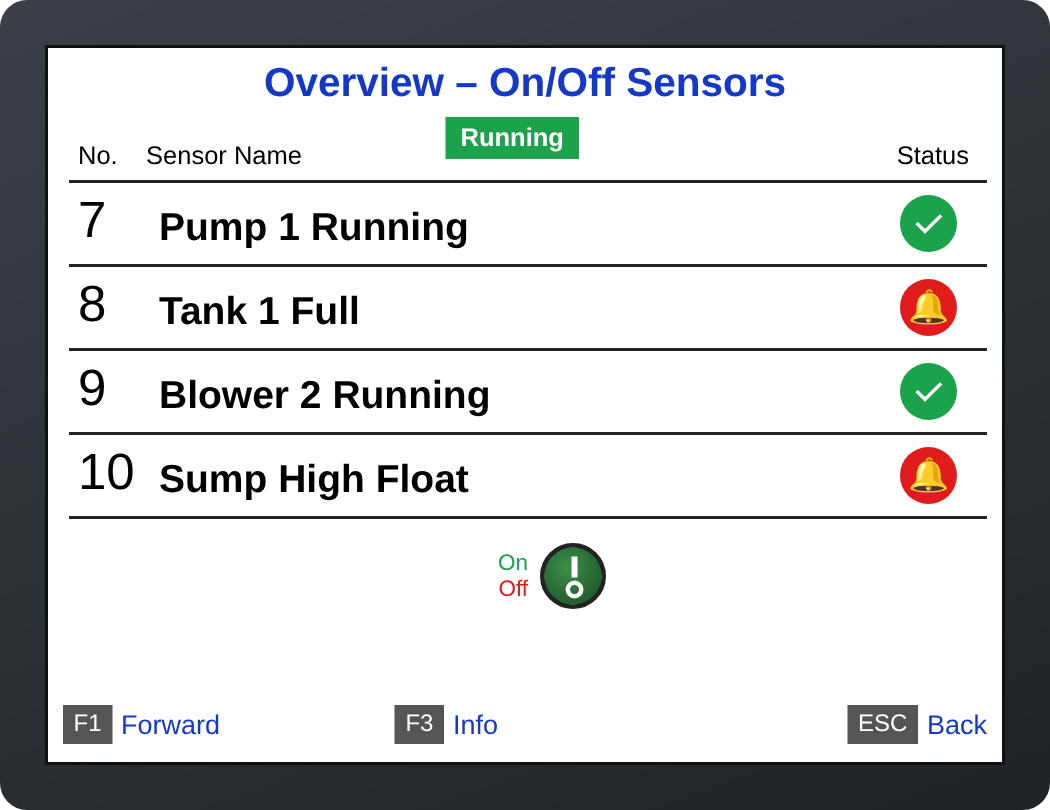
Overview – on/off sensors

Pumps running, tanks full, float switches, doors: every on/off signal in one list.

  • A green check means all is as it should be; a red alarm shows what needs attention.
  • Mix on/off signals and measurements on the same Watch.
Intell-i-Watch Dashboard screen

See your whole process at a glance

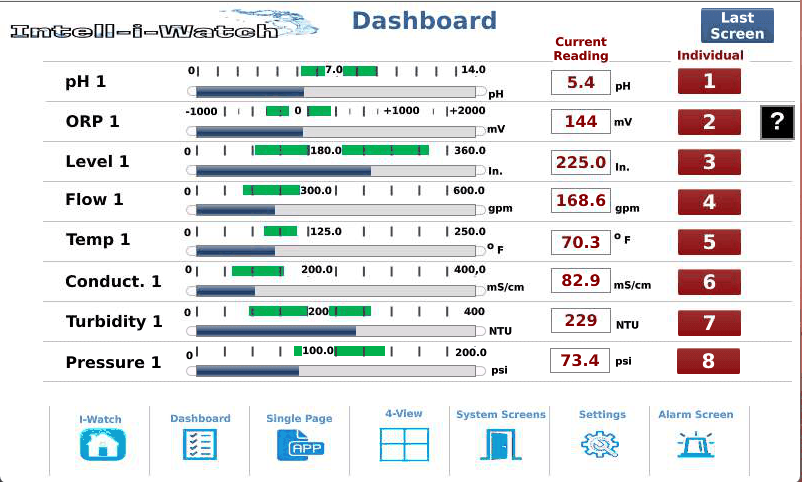
Dashboard

Every sensor's current reading, as a number and a bar graph, on one screen.

  • See at a glance where each reading sits on its scale.
  • Touch a sensor to open its own screen.
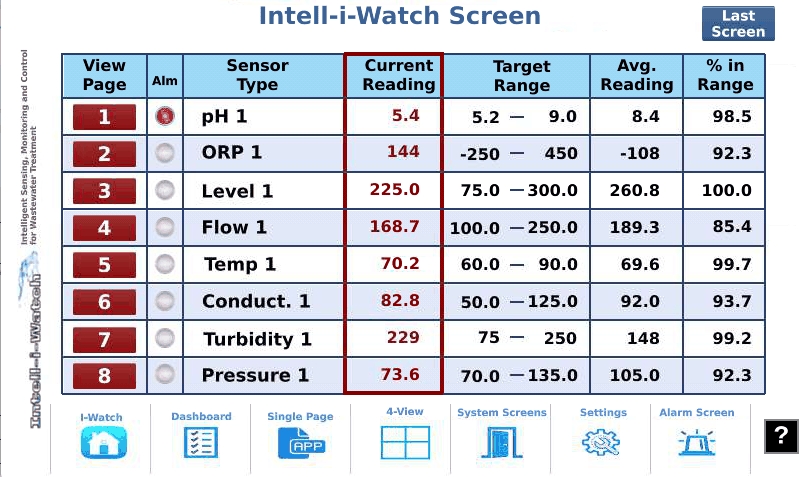
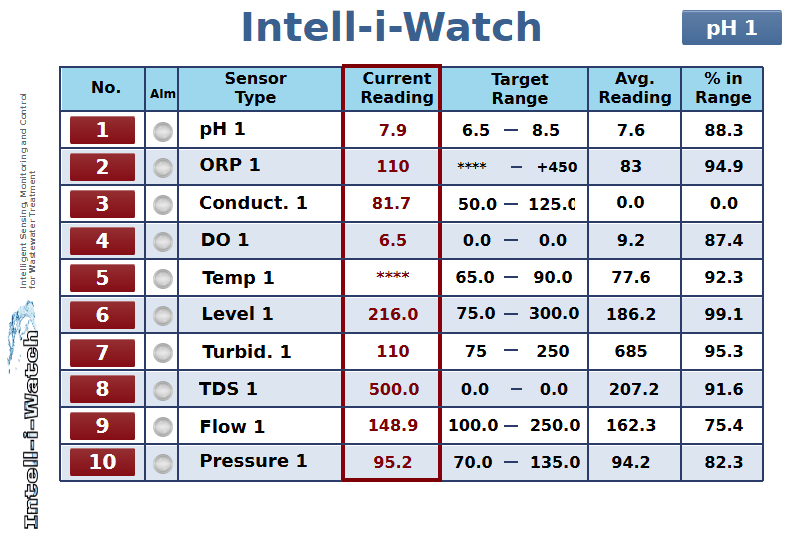
Intell-i-Watch Overview table screen

See your whole process at a glance

Overview table

Live readings side by side with each sensor's target range, its average and the percent of time it has stayed in range.

  • Shows not just where the process is now, but how well it has been running.
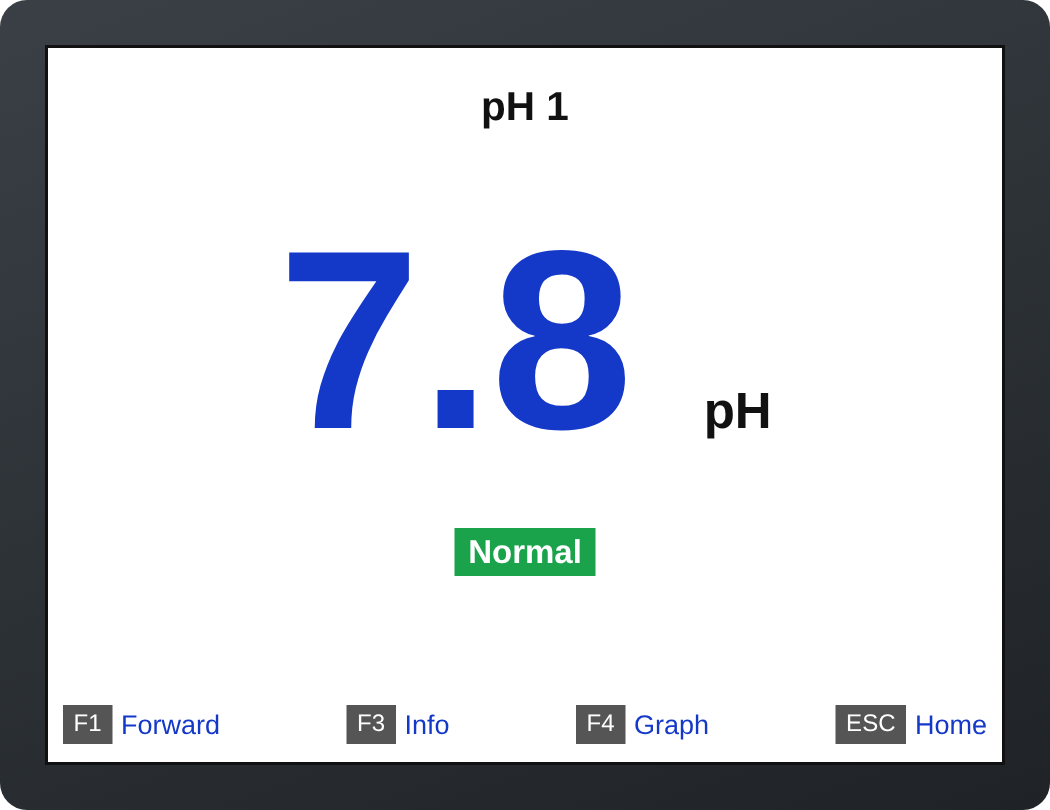
Intell-i-Watch Large-number view screen

See your whole process at a glance

Large-number view

One reading, big enough to read from across the room.

  • Ideal for the measurement operators check most often, like discharge pH.
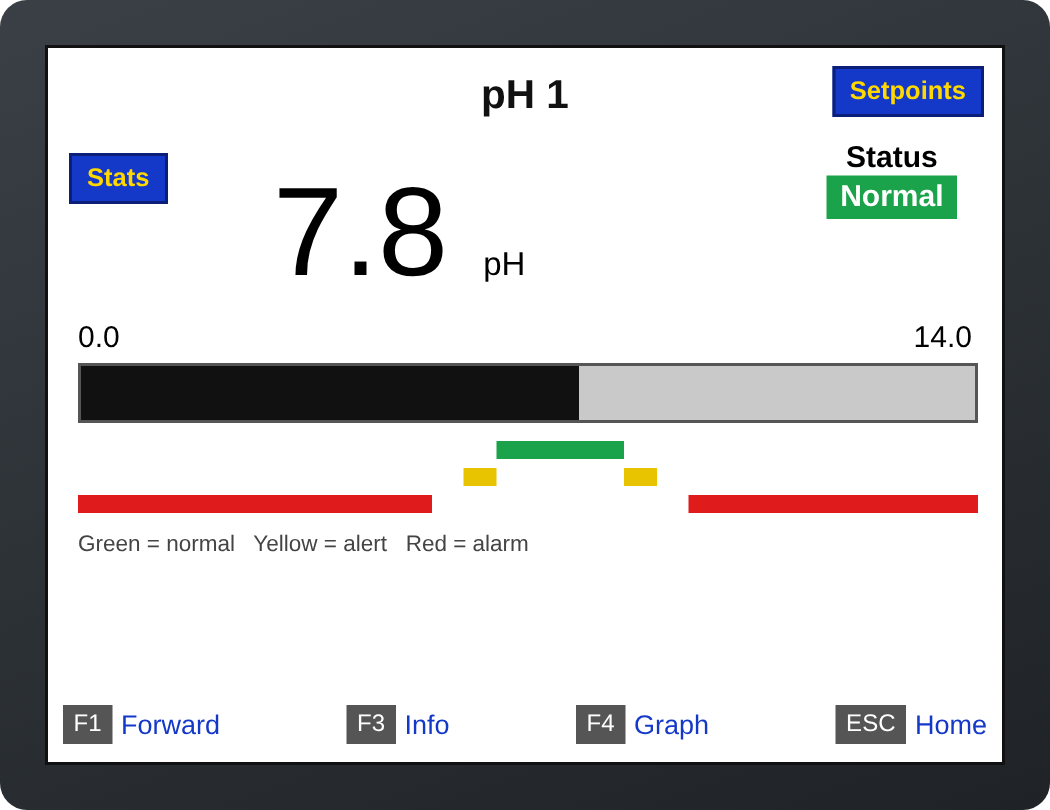
Intell-i-Watch Bar view with range bands screen

See your whole process at a glance

Bar view with range bands

The live reading on a bar, laid over its green, yellow and red bands.

  • See instantly how close the reading is to an alert or alarm limit, not just whether it has crossed one.
  • One touch to the sensor's statistics, setpoints or trend graph.
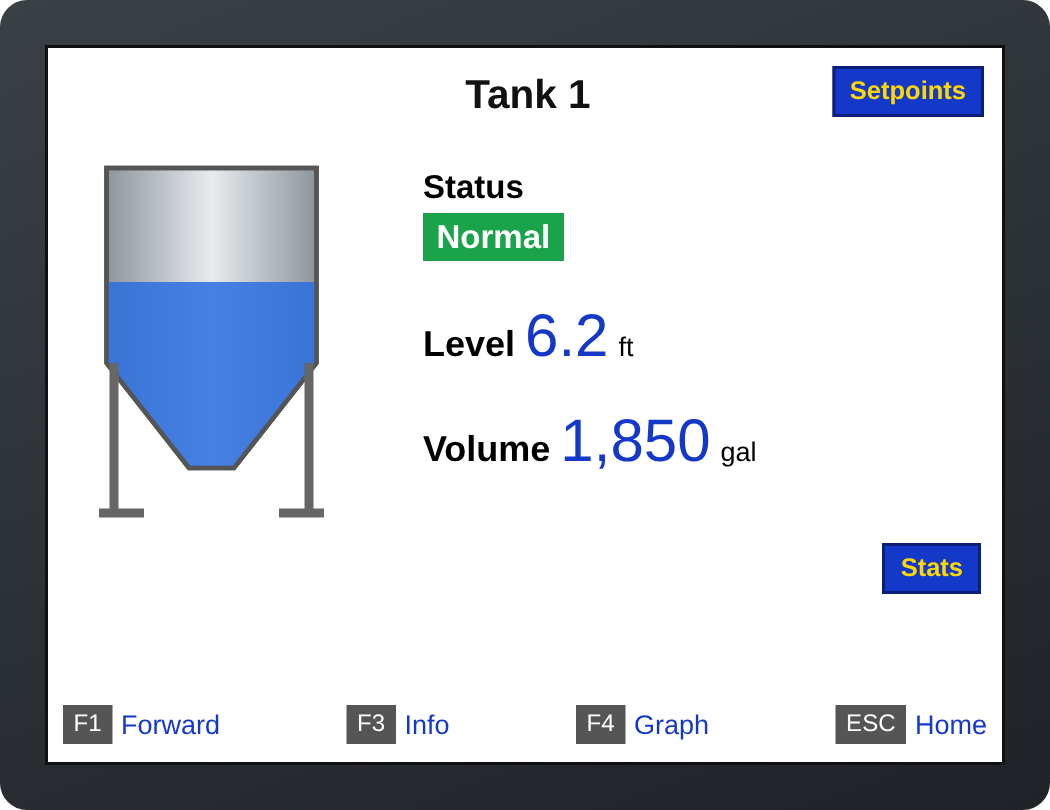
Intell-i-Watch Tank views screen

See your whole process at a glance

Tank views

Level and volume shown in a picture of your tank: cone-bottom or straight-wall.

  • The fill level moves with the reading, so anyone can read it at a glance.
  • Volume is shown along with level, plus the tank's status and links to its statistics and setpoints.
Intell-i-Watch 4-View screen

See your whole process at a glance

4-View

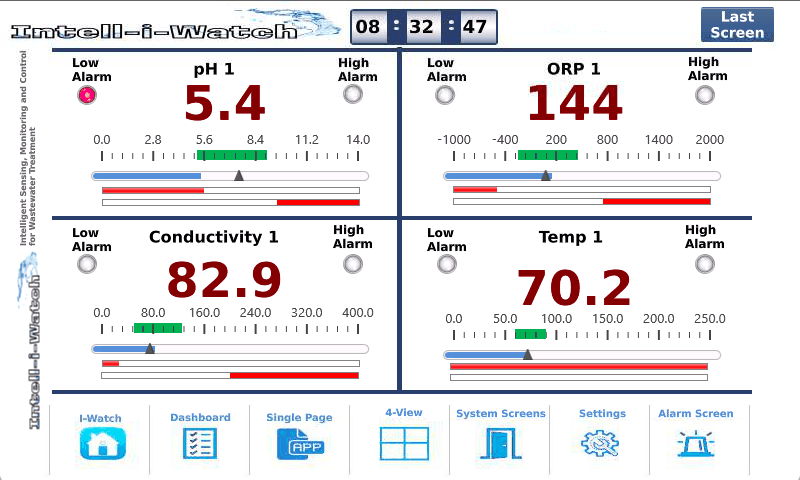
Four sensors in one screen, each with its reading, range and alarm status.

  • Group the sensors that belong together, such as the four readings for one treatment step.

Alarms that work the way you do

Intell-i-Watch Alarm setup screen

Alarms that work the way you do

Alarm setup

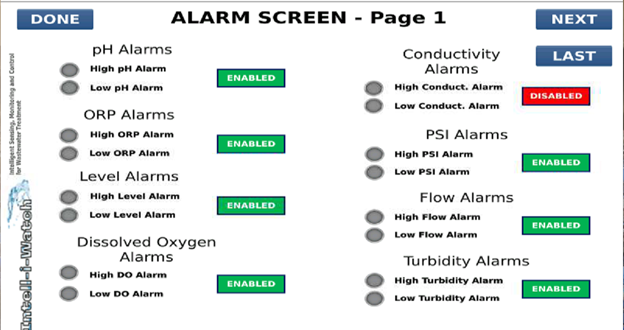
Turn the high and low alarms for each sensor on or off from one screen.

  • Clear Enabled / Disabled status for every alarm.
  • Alarms can be delayed to allow for process lag, so short, harmless spikes don't set them off.
  • Alarm notifications can also go out by email or text when the Watch is connected (optional, turned on with your approval).

Analysis right on the Watch

Intell-i-Watch Current statistics screen

Analysis right on the Watch

Current statistics

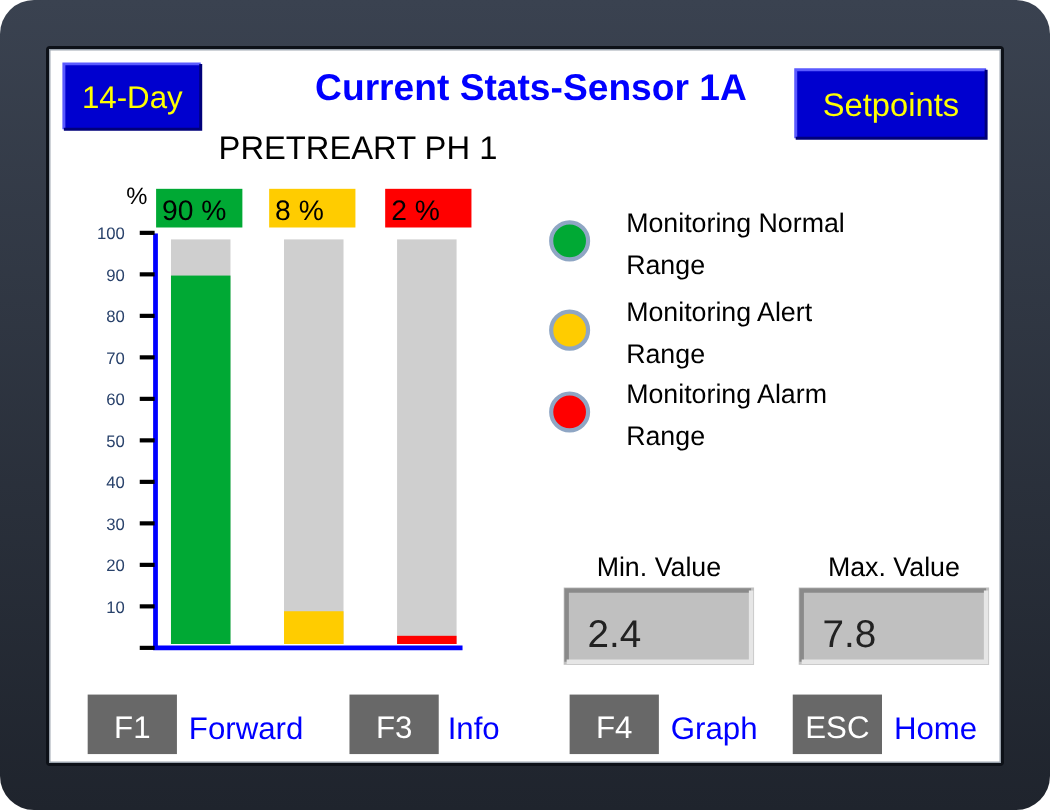
How well is the process really running? This screen answers in one look.

  • The percent of run time the sensor has spent in its normal, alert and alarm ranges, updated every 10 seconds.
  • The lowest and highest readings of the day while monitoring is on.
  • Each range can be monitored or turned off. Its indicator shows in color when monitored and white when off.
  • Monitoring can run continuously, be turned on and off from the screen, be started by an on/off sensor, or follow a daily schedule. Only the time actually monitored is counted.
  • Alarm time delays don't change the percentages.
  • One touch to the daily history, the setpoints or the trend graph.
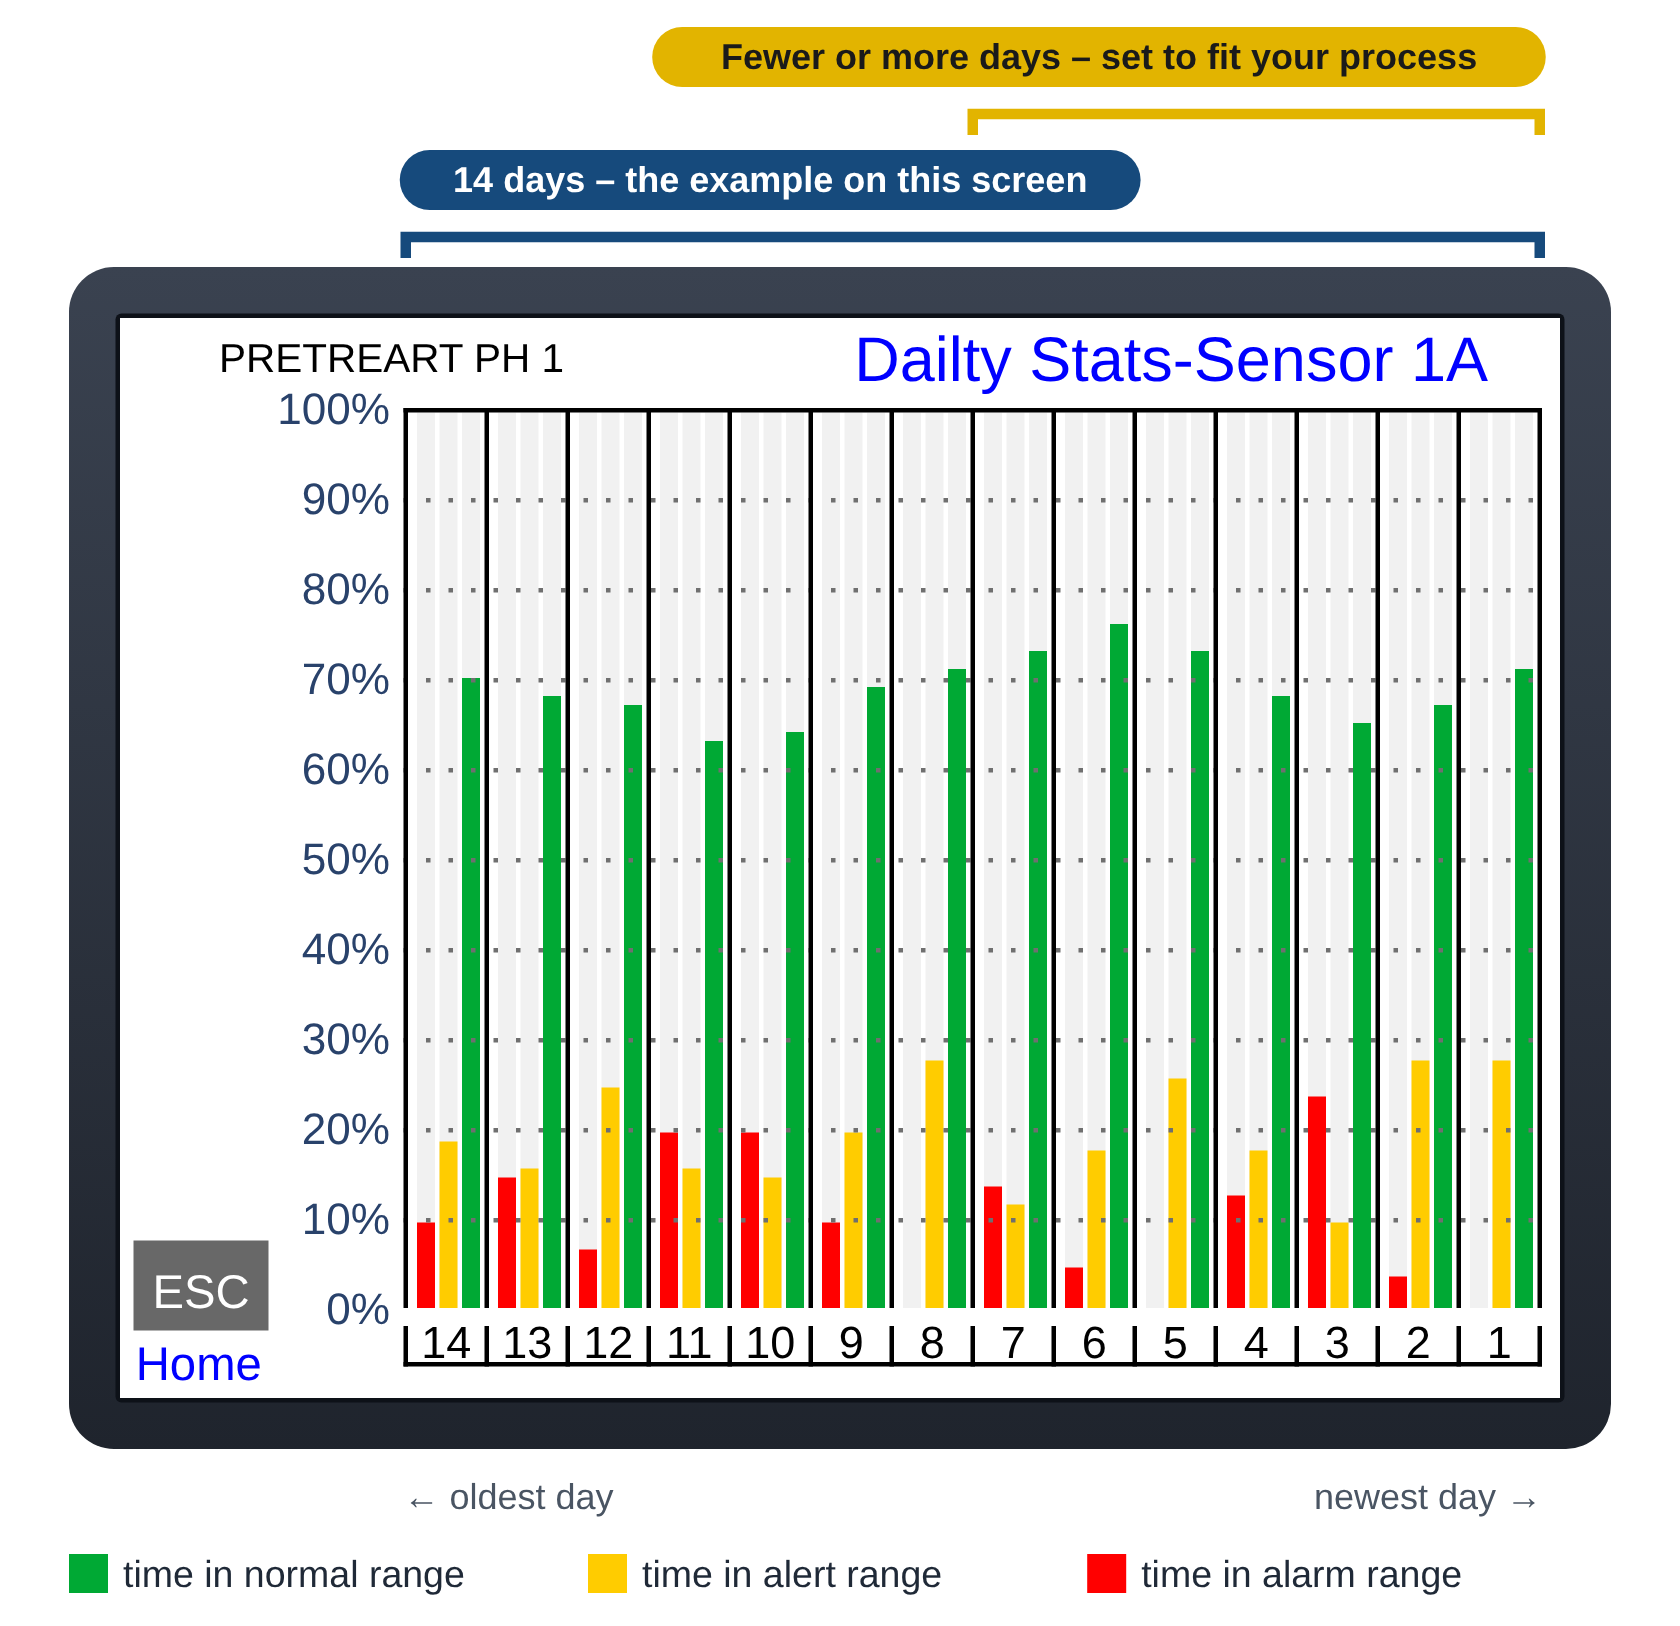
Intell-i-Watch Daily statistics (14 days shown) screen

Analysis right on the Watch

Daily statistics (14 days shown)

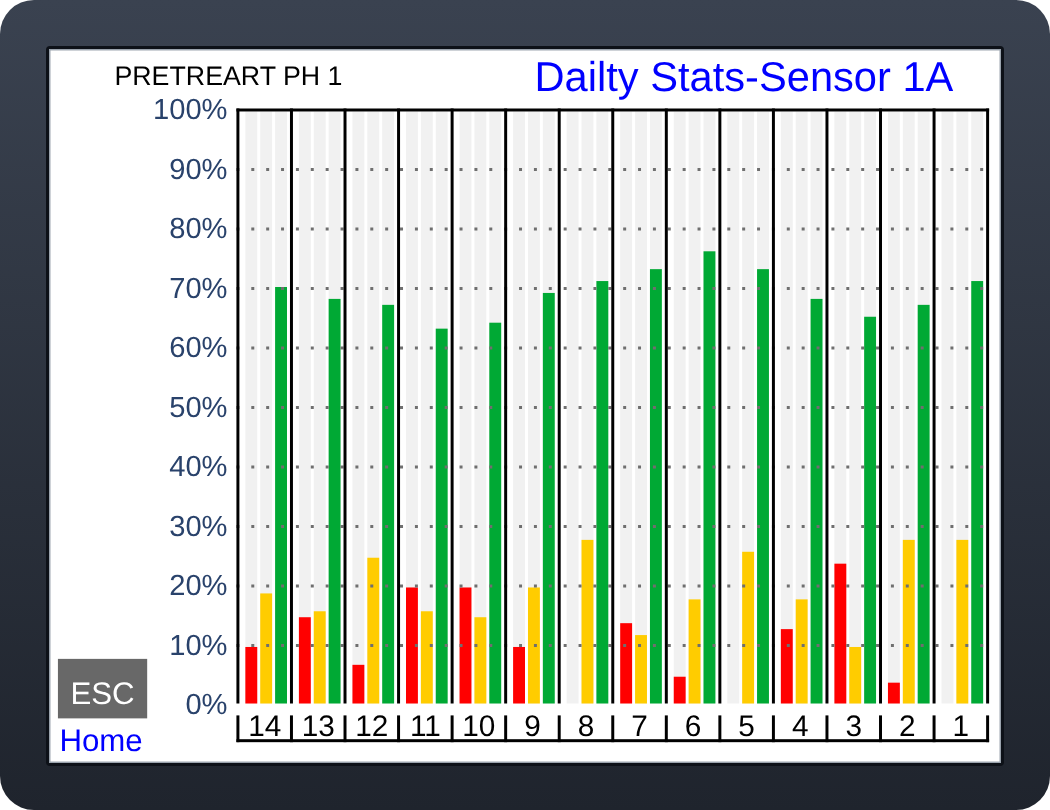
A group of bars for each operating day shows how much of that day the sensor spent in its normal, alert and alarm ranges.

  • Good days and problem days stand out immediately, without a spreadsheet.
  • A steady process shows a steady pattern. A change in the pattern is a sign to look closer.
  • 14 days is the example shown. The number of days can be customized (see below).
Intell-i-Watch Monthly statistics screen

Analysis right on the Watch

Monthly statistics

Month-by-month averages, minimum and maximum values, percent of time in range and number of alarms.

  • A full year of months on one screen, so changes over time are easy to see.
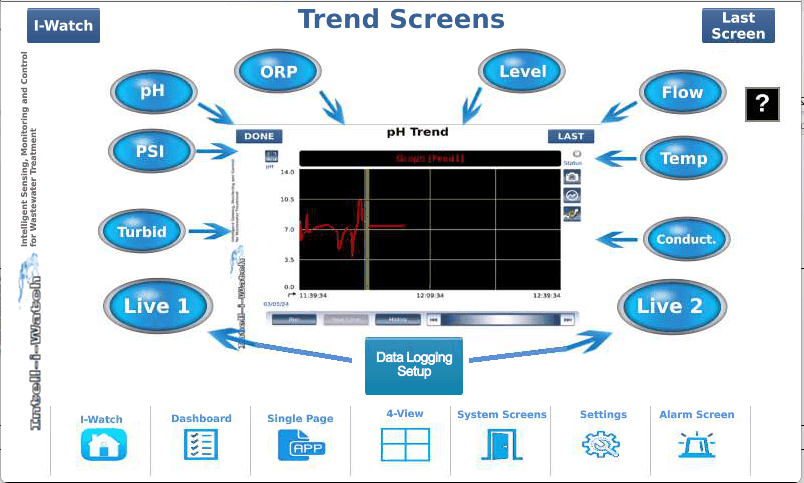
Intell-i-Watch Trend graphs screen

Analysis right on the Watch

Trend graphs

Readings drawn over time: live, short-term and archived.

  • See exactly when a change started and how long it lasted.
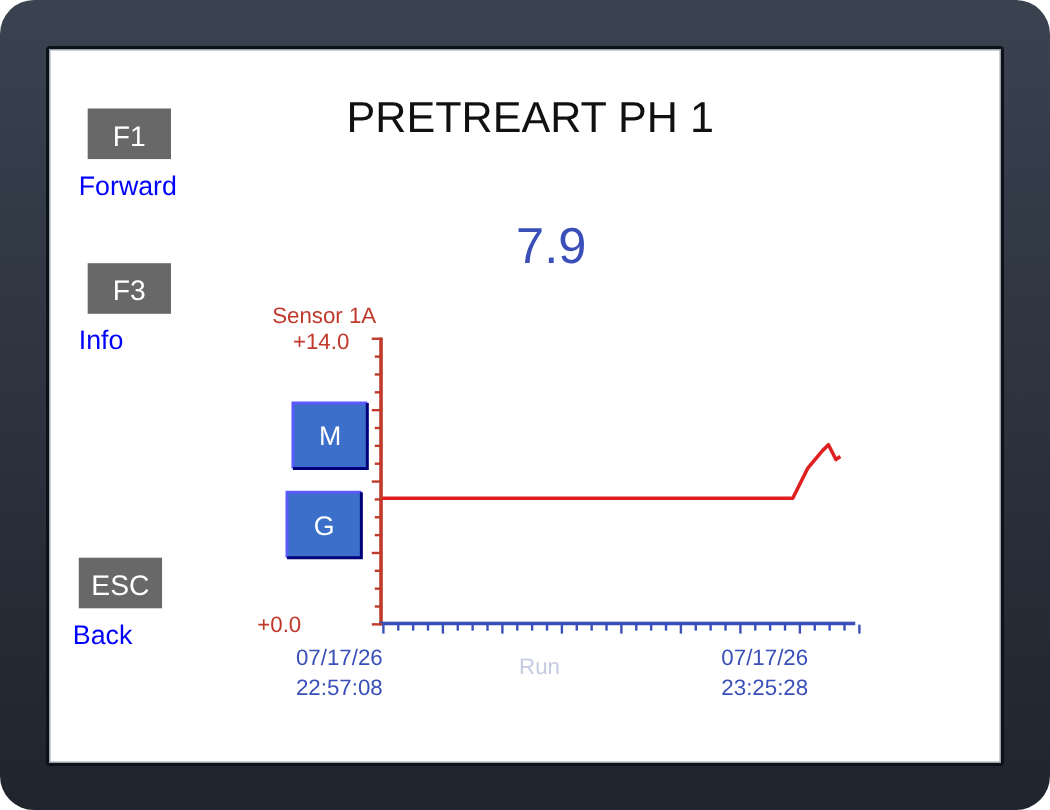
Intell-i-Watch Live trend screen

Analysis right on the Watch

Live trend

The live reading of one sensor drawn as a graph, updated every 10 seconds.

  • Up to the last 1,000 readings, about 2.8 hours, with 53 readings on each screen. Scroll back to see earlier readings.
  • The vertical scale comes from the ranges you enter, and the sensor name is spelled the way you enter it.
  • How often it samples, how many readings it keeps and how many readings show on each screen can all be customized.

Records you can rely on

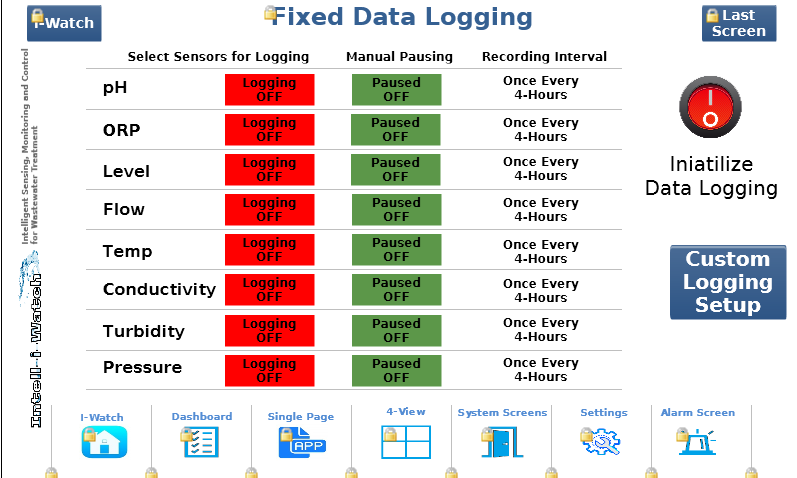
Intell-i-Watch Data logging screen

Records you can rely on

Data logging

Choose which sensors to record and how often.

  • Every reading is stored with its date and time.
  • Pause recording for a sensor when you need to, for example during maintenance.
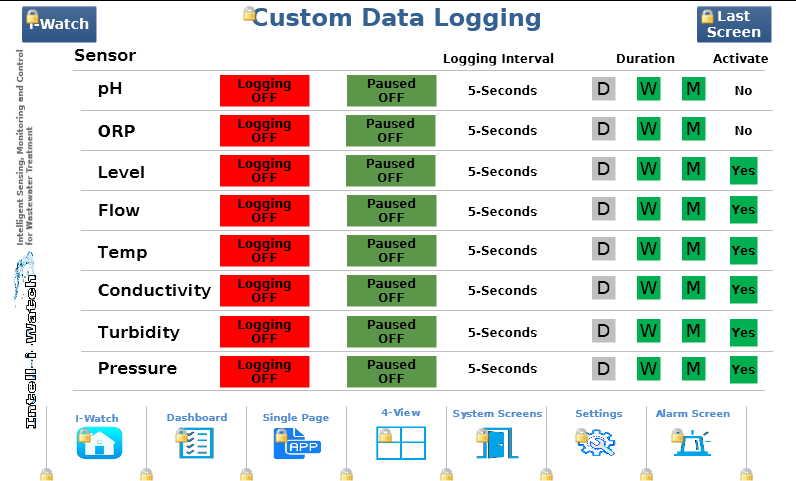
Intell-i-Watch Custom logging screen

Records you can rely on

Custom logging

Set a recording interval and how long to record, by the day, week or month, for each sensor.

  • Record every few seconds when you need detail, or less often for slow-changing processes.
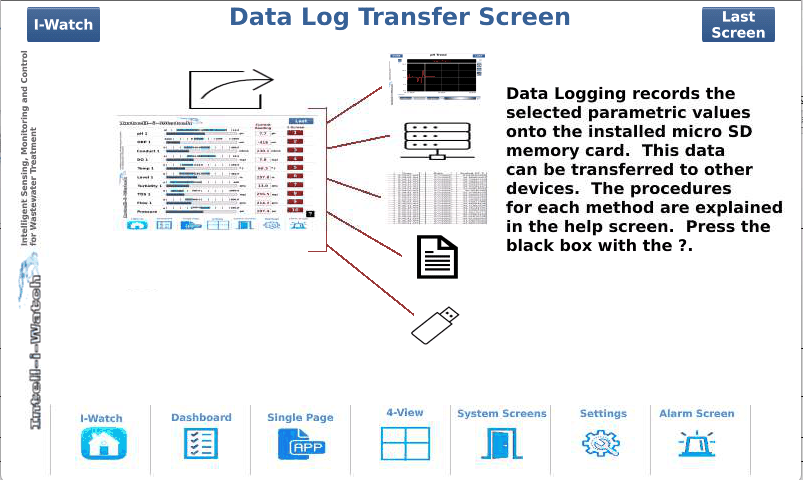
Intell-i-Watch Data log transfer screen

Records you can rely on

Data log transfer

On-screen steps move your data logs from the Watch's memory card to a USB drive.

  • Open them in Microsoft Excel as CSV files for your own reports.
Intell-i-Watch Web page view (optional) screen

Records you can rely on

Web page view (optional)

When connected, password-protected web pages show the readings in a browser.

  • Set up pages for specific people, so each person sees what matters to them. Turned on only with your approval.

Equipment care and maintenance

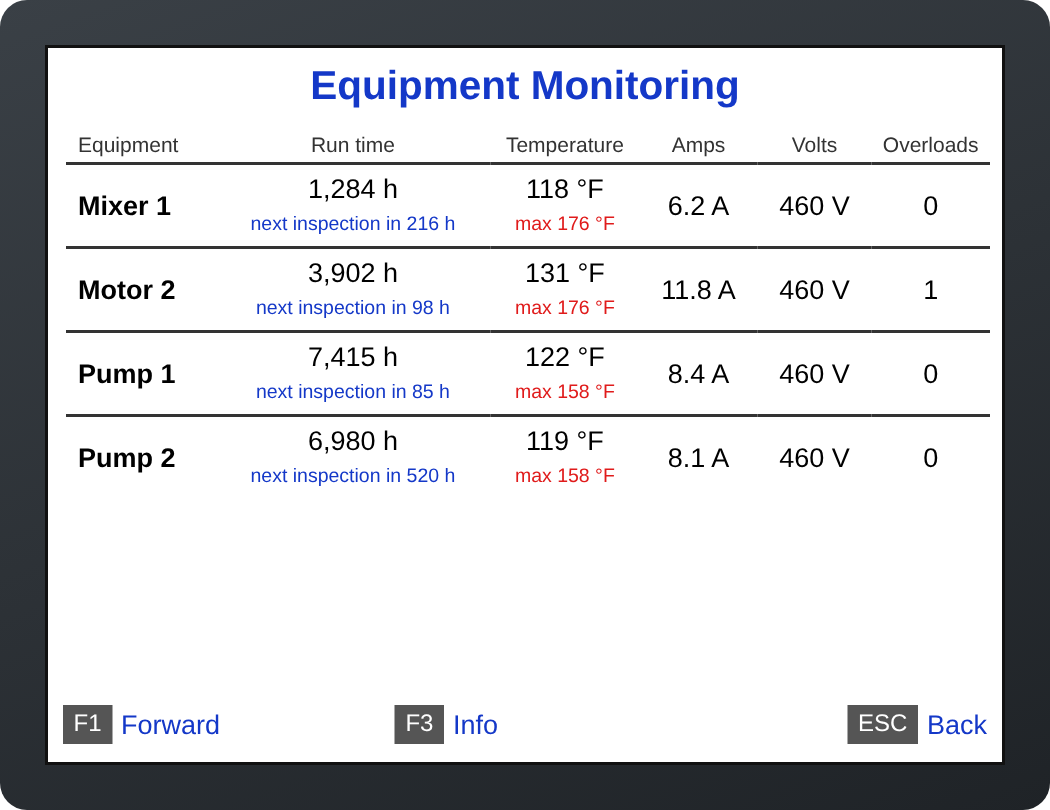
Intell-i-Watch Equipment monitoring screen

Equipment care and maintenance

Equipment monitoring

Motors, pumps and mixers on one screen.

  • Run hours for each machine, and the time left until its next inspection.
  • Temperature shown against the machine's rating.
  • Amps, volts and overload count.
  • Plan service from real run time instead of guessing, and catch a machine running hot before it fails.
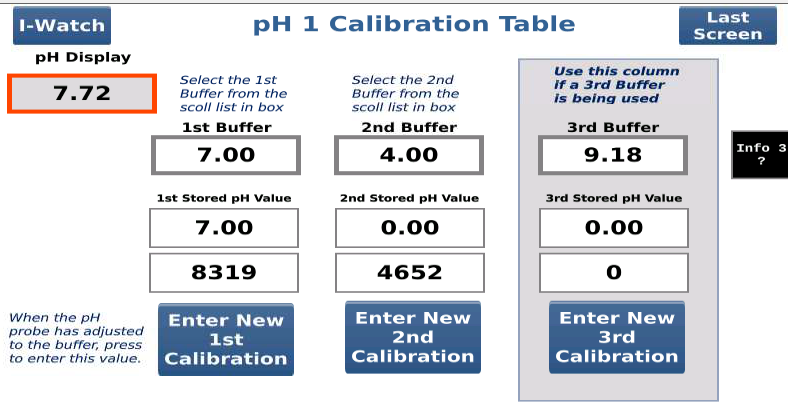
Intell-i-Watch Calibration screen

Equipment care and maintenance

Calibration

Calibrate a pH probe right at the Watch, with on-screen instructions.

  • Use up to three buffer solutions.
  • The Watch stores each calibration value, so the probe reads accurately.
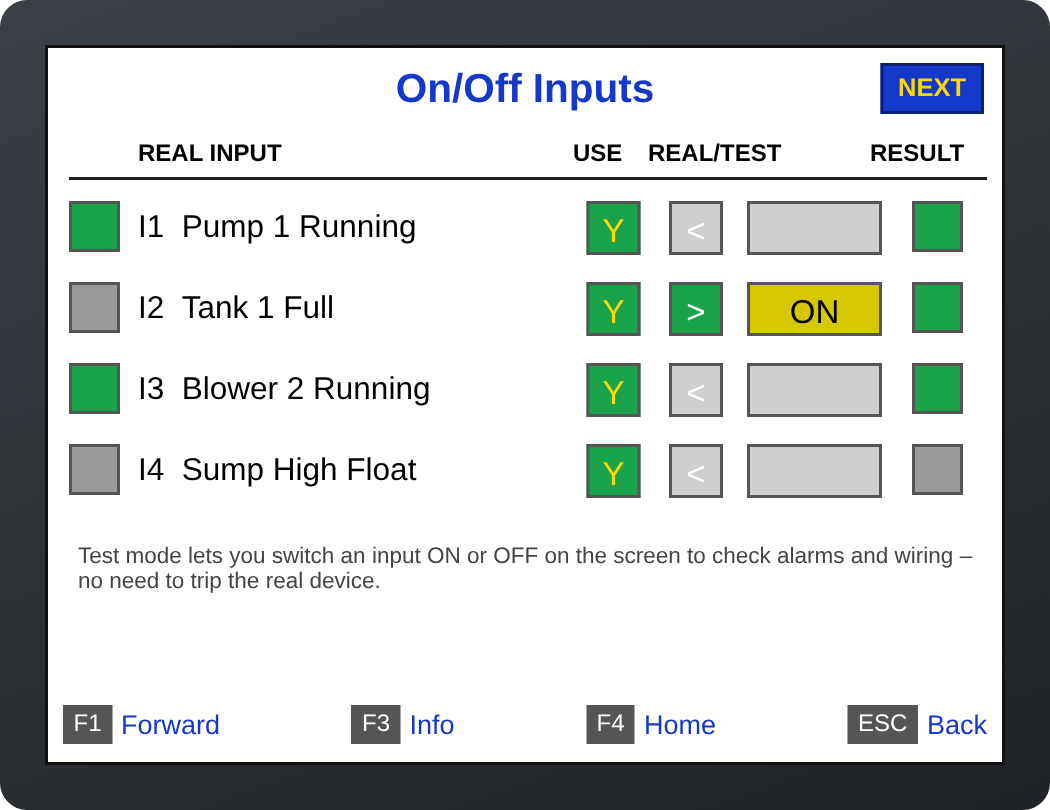
Intell-i-Watch Test mode for on/off signals screen

Equipment care and maintenance

Test mode for on/off signals

Check alarms and wiring without tripping the real equipment.

  • Switch an input to test, set it ON or OFF on the screen, and watch the Watch respond.
  • The real input status is still shown, so you always know what is really happening.
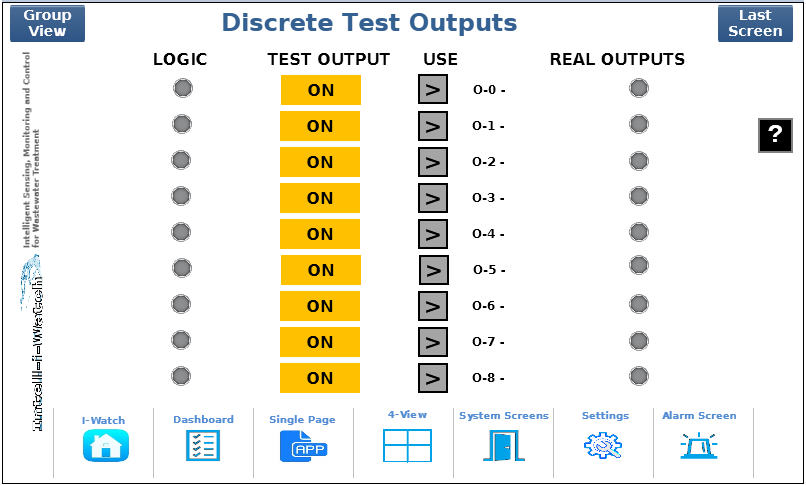
Intell-i-Watch Output testing screen

Equipment care and maintenance

Output testing

Turn each output on from the screen to check it and the equipment connected to it.

  • Confirm everything works before you depend on it.
Intell-i-Watch One-touch navigation screen

Equipment care and maintenance

One-touch navigation

Every screen has the same buttons along the bottom.

  • I-Watch (home), Dashboard, Single Page, 4-View, System Screens, Settings and Alarm Screen, always one touch away.

Download the screen guide (PDF)

You choose the analysis window

The daily statistics screen shows the last 14 operating days as an example. The number of days shown can be customized to fit your process.

Intell-i-Watch Daily Stats screen for Sensor 1A: time in the normal, alert and alarm ranges for each of the last 14 operating days. The number of days can be customized

Each column is one day the system was operating. Days when it is shut down, such as a weekend or holiday, are not counted, so the chart always shows the most recent days of real operation.

When a new day's results are ready, they are added at the right and the oldest day drops off, so the picture is always current.

For each day, the Watch shows how much of the operating time the sensor spent in its normal, alert and alarm ranges. A process meant to be steady shows a steady pattern, and a cyclical process shows a repeating one. A change in the pattern is a sign to look closer.

This chart is a quick snapshot of recent performance, not a permanent record. For a permanent record, turn on data logging for any sensor: each reading is stored on the SD card with its date and time.

All of this is calculated on the Watch itself. No network, cloud or remote access is needed to see it.

  1. The Watch takes a reading from each sensor every 10 seconds.
  2. Each reading is counted in the normal, alert or alarm range it falls in.
  3. When a day's results are complete, they become one column on the chart.
  4. The number of days the chart shows can be customized.

Analyze and act

Run time

Part of the Intell-i-Watch monitoring includes elapsed run-time monitoring.

Patterns

When process patterns develop, they can be detected and applied to routine service checks or sensor calibration adjustments or even replacement.

Repeated alarms

If conditions produce repetitive occurring faults, this data would suggest the need for a review of the components for suitability in the application. In some cases, it may be the correct component but just not installed or mounted for optimal service life and performance.

Period statistics

The Watch monitors each sensor measurement on a real-time basis and calculates rolling averages as well as capturing the minimum and maximum values, with period values for month-to-month comparisons.

Tell us what you need to monitor

We'll match a Watch model and sensors to your application. Call 262.716.0105 or send the details and we'll follow up with a recommendation and pricing.